In Part 1, I set out that speculators have been hoping for a goldilocks scenario in which a combination of fear factors from Covid and lockdowns in China, war in Ukraine, high energy and food prices, combined with small rises in central bank policy rates, would lead to an economic slowdown so that unemployment would rise, putting downward pressure again on wages, allowing profits to rise, and also downward pressure on the demand for capital, so causing interest rates to decline. It would give central banks room to again stop raising their policy rates, and even reduce them, as well as ceasing any tightening of liquidity. All of that is required to prevent asset prices crashing, and so crushing the paper wealth of speculators and the ruling class. However, no such Goldilocks scenario is likely as, in fact, consumers remain strong, inflation pressures continue, and workers look set to get big pay rises, enabling them to continue spending and driving economic growth.
And, that was the picture indicated in an interview on Bloomberg, last Wednesday, with Brian Moynihan CEO of Bank of America. Moynihan's analysis was based on the bank's access to raw data from its customers. These are the highlights of his analysis.
- The average depositor who had an average $1400 account balance pre-lockdown, now has around $4,000 average balance, those with an average balance of around $3,500, now have an average balance of $13,000.
- Credit card balances have been drawn down from around $100 million, to $70 million, and has now risen to $80 million.
- This is due to payments made to households by the state during lockdowns, when consumption was limited, so enabling debts to be paid down, and savings accumulated, meaning consumers have a lot of firepower to continue spending, as the economy opens up again.
- In the first 2 weeks of May, consumers spent 10% more than they did in May last year, and that is not just because of higher prices. The number of transactions themselves increased by 8%.
- The amount spent on travel rose by 10% compared to 2019.
- Projections for the unemployment rate fall to around 2% for later this year, and down into a sub 2% level next year.
So, in the US at least, the consumer still seems to be strong, to have rebuilt domestic balance sheets so as to be able to fund continued consumption, and with projections of employment rising further, and unemployment declining to near full employment levels, with rising unionisation, wages are set to rise, to fund additional consumption. The latest jobless claims data, released on Thursday, in the US, confirmed that picture, with claims falling to 210,000 for the week, below estimates, and below the figure for the previous week. As described in other posts, even part of these numbers is attributable to a strong jobs market, because it reflects a rising “quit rate”, as workers quit their existing jobs to move to a better one. The Q1 GDP data was revised slightly worse by 0.1% to – 1.5%, but that reflects continued effects of renewed lockdown measures, and as the BEA set out,
“reflected decreases in private inventory investment, exports, federal government spending, and state and local government spending, while imports, which are a subtraction in the calculation of GDP, increased. Personal consumption expenditures (PCE), nonresidential fixed investment, and residential fixed investment increased”.
In fact, as the above mentions, and as Brian Moynihan had noted, consumer spending increased, no doubt explaining some of the increase in imports, and PCE inflation continued to rise. The effects of lockdowns were not just in the reduction in new value creation, but also in the fact that previous income replacement schemes from the state ceased, so that those payments no longer appeared as income of recipients.
“In the first quarter, an increase in COVID-19 cases related to the Omicron variant resulted in continued restrictions and disruptions in the operations of establishments in some parts of the country. Government assistance payments in the form of forgivable loans to businesses, grants to state and local governments, and social benefits to households all decreased as provisions of several federal programs expired or tapered off.”
(ibid)
As I have set out in the past, changes to inventories can be positive or negative. An increase in inventories can be because firms stock up on the basis of known increased demand, but can also be a result of inability to sell stocks. A fall in inventories can be as a result of firms seeing slowing demand, and acting accordingly, or a result of stocks having been sold, without replacements yet arriving. Given continued increases in consumption, combined with known supply bottlenecks, the latter seems a likely explanation, and so, is likely to provoke a rebound in the next quarter. However, as the economy opens up again, there is also a known switch away from spending on goods to spending on services, a fact that shows up in the sales of Wal-Mart and other retailers, combined with increasing revenues for service industries. It's firms selling goods that require inventories, as against services, whose main circulating capital takes the form of labour-power.
“The price index for gross domestic purchases increased 8.0 percent (revised) in the first quarter, compared with an increase of 7.0 percent in the fourth quarter (table 4). The PCE price index increased 7.0 percent, compared with an increase of 6.4 percent. Excluding food and energy prices, the PCE price index increased 5.1 percent (revised), compared with an increase of 5.0 percent.”
(ibid)
These are not the conditions leading to a slowing economy, let alone recession. A combination of increased employment, and rising wages, means a growing demand for wage goods, and with recognition of the effects of inflation, consumers are likely to bring forward spending – in the same way that in conditions of deflation they defer spending – which boosts demand further. Competition drives firms to increase output, and with sluggish or stagnant productivity growth – and even declining productivity due to increased frictions and supply bottle necks – that means even greater demand for labour, pushing wages higher still.
In another recent article, John Authers examines the relation between inflation and asset prices. Its normally assumed that, in times of inflation, shares outperform bonds. The real value of a bond falls as a result of inflation, as does that of the coupon, unless it is an inflation linked bond. The result is that bond prices fall, as speculators seek to protect themselves against these real terms losses. Shares, however, tend to rise, because inflation means that firms raise their prices, which, in turn, increases their nominal money profits, providing a hedge against the inflation, and also means that nominal money dividends can increase along with the profits. Shares and bonds are seen as substitutes for each other, so that when shares rise, bonds fall and vice versa. On this basis, the idea of a portfolio comprising 60% shares, and 40% bonds was developed. If share prices rise, increasing the proportion of shares in the portfolio, some are sold, and bonds bought to rebalance it, and vice versa.
But, as I have set out, in fact, bonds and shares are both financial assets, and the prices of both can and do rise and fall together. Over the last 30 years, as increasing liquidity inflated the prices of all assets, both bond and share prices rose astronomically, and it was only in the short run that one acted as an alternative to another. The same was true of property prices. Authers looks at historical data provided by Jim Reid of Deutsche Bank. Authers says,
“Reid and his team divided the stocks and bonds of 15 different countries into valuations deciles. A very low number suggests that both stocks and bonds look universally cheap, while a high one suggests both look too expensive. It’s inflation that makes both cheaper at once, and the lack of it that allows them to grow more expensive together. The higher the valuation, the lower the subsequent returns are likely to be.”
He provides the chart that resulted from their analysis.

In fact, this confirms the chart I have posted in the past, showing an inflation adjusted history of the Dow Jones.

But, as I have set out in those previous posts, what is actually being confused, here, is the role of inflation, as against the role of periods of long wave uptrend, and consequent rising interest rates. A look at the chart for UK Bank Rate illustrates the point.

It rose gradually from 4% in 1900 to 7% in 1920, and remained around that level until 1932. The former period was a period long wave crisis, and the period from the late 1920's one of stagnation. As Marx says in Capital III, its during the period of crisis that interest rates peak, and during the period of stagnation that they fall to their lowest levels. It remained at 2% between 1932 and 1951.
The fourth long wave upswing began in 1949, and by the early 1960's, the relative surplus population was beginning to be used up. Wages began to rise, and the economy expanded, as the demand for wage goods rose. Wages began to squeeze profits, but firms had to continue to expand to meet the rising demand, so causing the demand for money-capital to exceed the supply from realised profits, causing interest rates to rise. As the chart shows, Base Rate rose from 4% in 1960, to 8% by 1968, but as the period of crisis began in the mid 1970's, the rate rose even more sharply, reaching a peak of 17% in 1978. To compensate for squeezed profits, liquidity increased, and that illustrates the point that interest rates can rise, at the same time that liquidity is increased. The increase in liquidity came from two sources. The central banks, and commercial banks, and from the expansion of commercial credit.
As Marx states, credit develops alongside capitalist production. As the economy expands, commercial credit expands automatically along with it, as firms extend credit to each other, and ship more and more commodities to each other, allowing longer and longer grace periods for payment. This goes on, in periods of economic expansion, irrespective of any attempts by central banks to restrain economic activity, and credit growth, by raising policy rates. Marx notes the comments of Bank of England Governor, Neave, and of Thomas Tooke.
"The Bank has no power of its own volition to extend the amount of its circulation in the hands of the public; but it has the power of reducing the amount of the notes in the hands of the public, not however without a very violent operation."
(Capital, III, Chapter 33)
But, Marx also cites the following exchanges in parliament on the bank crisis of 1857,
Marx quotes the following exchanges.
"5306. If there should not be currency to settle the transactions at the clearing house, the only next alternative which I can see is to meet together, and to make our payments in first-class bills, bills upon the Treasury, and Messrs. Smith, Payne, and so forth." — "5307. Then, if the government failed to supply you with a circulating medium, you would create one for yourselves? — What can we do? The public come in, and take the circulating medium out of our hands; it does not exist." — "5308. You would only then do in London what they do in Manchester every day of the week? — Yes."
(ibid)
This illustrates the problem that central banks have, today, in trying to restrain inflation, compared to the situation that faced Volcker, and other central bankers in the 1980's. The 1980's, like the 1930's was a period of long wave decline. The early 80's were still a period of crisis, but already labour was on the back foot, as new labour saving technologies came in to replace them, causing unemployment to rise, and wages to fall. Gross output grew more slowly than net output, as the rate of profit was ratcheted back up, having been squeezed in the 1960's and 70's, by rising wages. When central banks raised policy rates, and reduced liquidity, to slow the economy more quickly, in the early 80's, and so squeeze out the inflation, it was the kind of “violent operation”, referred to by Neave. Yet, it was the perfect conditions for doing so. In a period of slowing economic activity, there was no immediate desire by firms to rush to expand commercial credit, as an alternative to bank credit, or cash payments.
That is not the conditions that exist today. Since 1999, a new long wave uptrend has been underway, and was the basis for the global financial crisis of 2008, as this economic growth prompted rises in interest rates that crashed asset prices that had been inflated out of all rational proportion. It has only been deliberate state policy since 2010, via fiscal austerity to restrain economies, combined with QE aimed directly at pumping additional liquidity into the purchase of financial assets, combined with government policies to artificially goose property markets, that also acted to divert money and money-capital away from the real economy and into speculation in financial and property markets, in search of more or less guaranteed capital gains, and which has inflated those asset prices even more into the realms of fantasy.
Even that did not prevent the underlying dynamic of long wave growth from forcing its way through, and, in the last couple of years, it has only been direct physical action to stop economic activity via lockdowns that has restrained it. But, as I predicted more than a year ago, that would be counterproductive, because as soon as those lockdowns were lifted, as sooner or later they would have to be – and that applies in China too – it would simply lead to a huge surge in demand, prompting an equally large surge in supply, and demand for inputs, which in conditions of oceans of available liquidity would lead to widespread, and rising levels of inflation that would hit economies in a series of waves.
In an interview on Bloomberg on Thursday, Geoffrey Yu, of BNY Mellon, pointed out that there are billions of Yuan in the hands of Chinese consumers that will hit services markets across Asia, as soon as those consumers are released from current lockdowns. The statements from Premier Li Kashing in relation to the Chinese economy, seem to contradict those of President Xi, suggesting already that public discontent at the irrational continuation of lockdowns is beginning to feed into factional disputes within the ruling party, and state bureaucracy.
As Authers also points out, history shows that inflation always comes in this series of waves, as the liquidity washes into one sphere after another, which, in a globalised economy, then washes back again.

The idea that inflation has peaked is, then misguided, because so long as liquidity continues to be increased, inflation will increase along with it, whatever central banks do with their policy rates. Indeed, with commercial credit also acting as currency, even when central banks do, eventually get around to reducing liquidity, rather than just increasing it more slowly, liquidity will continue to expand for some time after that. But, the reality is that, whilst central banks will continue to raise policy rates – and will do so way beyond the current projections – they will be bound to respond to any squeeze on profits from rising wages, by themselves increasing liquidity again. The inflation is here for much longer than is currently expected, and its only reduced profits absorbing the rising wages that offer the prospect of it eventually being driven out of the system.
What, Authers and Reid saw as a link between asset prices and inflation, is, therefore, actually a link between asset prices and interest rates. In fact, as Marx says, these Bank Rates are not actually a good measure, and we should really take the market rate of interest charged by businesses for the supply of capital, and I suspect that were that data collated over these periods, it would be even clearer. Authers does, however, provide another useful chart produced by Man Group. It shows that inflationary periods do not generally overlap with recessions, the exception being, Authers says, the 1970's. Marx makes a similar point that an inflation of prices always precedes a crisis, during which commodities cannot be sold, and during which, therefore, commodity prices fall significantly.
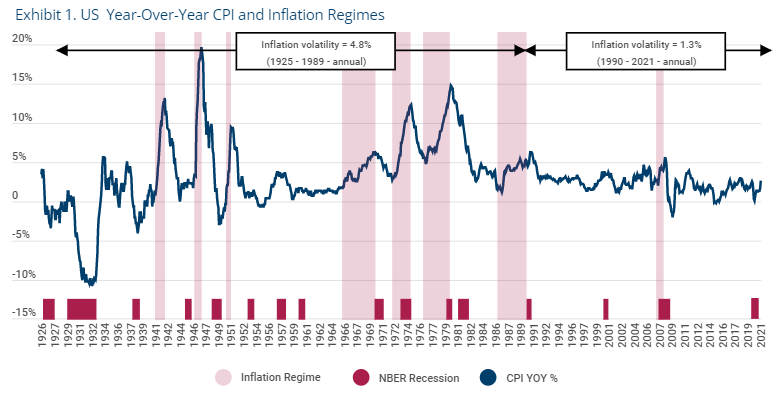
Its very unlikely, for the same reasons that the current inflation, which is going to be around for several years, will coincide with a recession either, or any kind of stagflation. Rather, looking at the chart, and combined with that for the waves of inflation, this looks more like the first inflationary waves of the 1960's, with the big inflationary waves of the 1970's still some ten years in the future, as the long wave proceeds, and labour shortages intensify, causing wages to rise further, and squeeze profits, resulting in a crisis of overproduction of capital. But, as inflation continues, even at these levels, central banks will have no room to claim any grounds for pausing their rises in rates, which are currently way behind the curve, and massively negative in real terms. The only way they can justify that is on the basis of the continued fairy tale about inflation being transitory, just a bit less transitory than originally suggested. The idea that it returns to 2% within the next two years is a fantasy.
When speculators in the financial and property markets realise that, the ground beneath their feet will disappear.
No comments:
Post a Comment